Blake Bauer · 3 October 2026
Mapping Data Pipeline Bottlenecks Within Integrated Cargo Visibility Platforms During High-Volume Import Periods
Integrated cargo visibility platforms aggregate shipment data from ports, carriers, sensors, and customs systems to provide real-time tracking, and these systems encounter measurable strain when import volumes surge. Data pipelines in such platforms handle ingestion, transformation, and distribution of information across multiple sources, yet high-volume periods expose specific constraints in throughput and latency. Observers note that October 2026 aligns with seasonal import peaks driven by holiday supply chains, creating conditions where pipeline mapping becomes essential for maintaining operational continuity.
Core Components of Cargo Data Pipelines
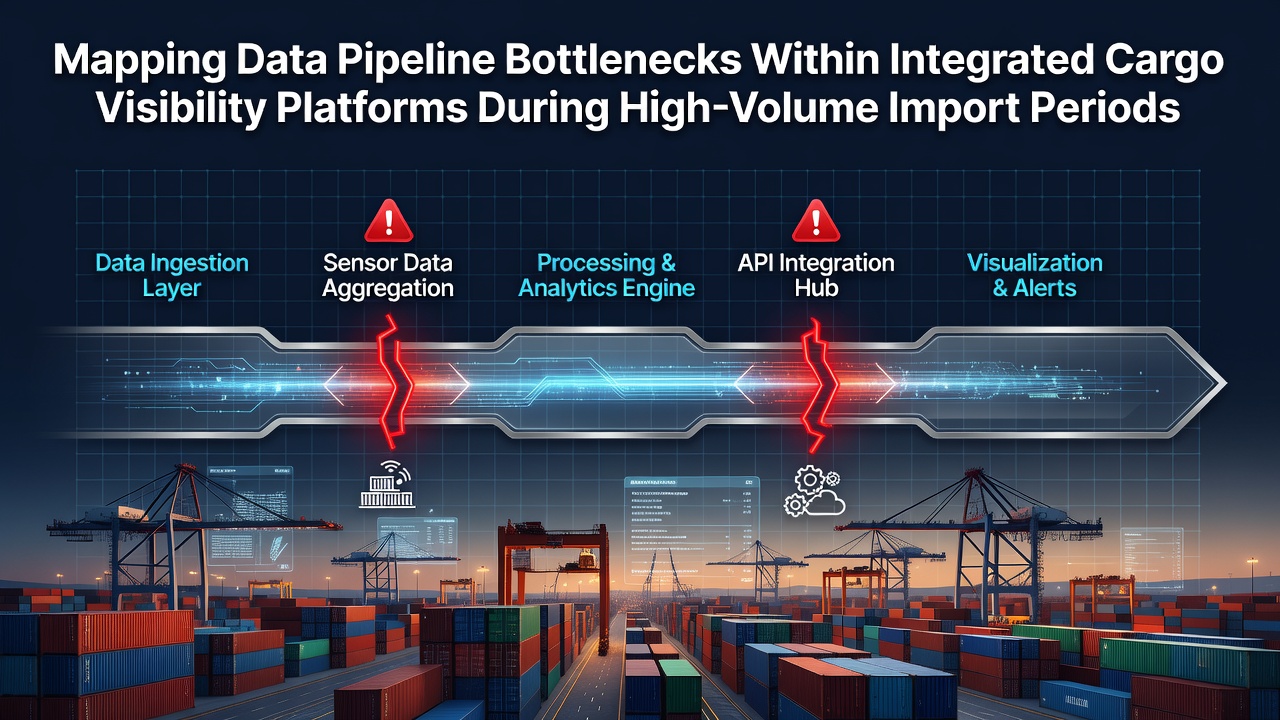
Researchers have documented how these pipelines typically begin with raw data capture from vessel tracking APIs, RFID readers at terminals, and electronic data interchange feeds from freight forwarders. Transformation layers then standardize formats before routing outputs to dashboards, alerts, and downstream analytics modules. According to trade data compiled by Eurostat, container throughput at major European ports increased by 12 percent during comparable peak quarters in prior years, which directly correlates with elevated message volumes entering visibility platforms. The process relies on sequential stages where each handoff introduces potential points of delay if buffer capacities or processing queues reach saturation.
Documented Bottleneck Patterns in High-Volume Scenarios
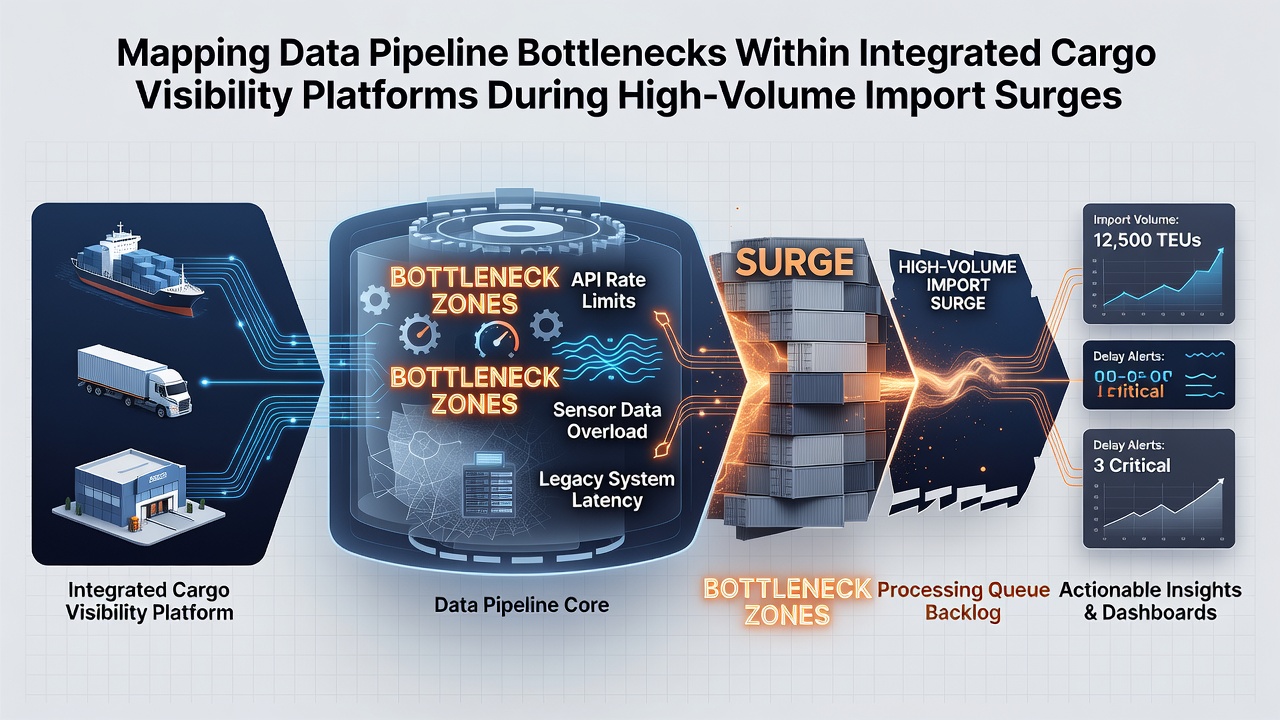
Studies from logistics research institutions reveal recurring choke points at the ingestion layer when concurrent API calls exceed allocated rate limits, resulting in queued messages that accumulate during port congestion events. Transformation stages show latency spikes when data validation routines encounter inconsistent formats from multiple carrier systems, and distribution endpoints experience backpressure when visualization tools attempt simultaneous queries on shared databases. One analysis of North American port operations found that message processing delays averaged 47 seconds per container record during peak weeks, compared with 9 seconds under baseline loads. These patterns emerge because pipelines often operate on fixed resource allocations that do not scale automatically with import surges.
Ingestion Layer Constraints
Data intake mechanisms face volume spikes from aggregated feeds, and experts tracking system logs have identified dropped packets when network throughput caps are reached. Parallel processing threads help mitigate this in some architectures, yet synchronization overhead grows as the number of active sources multiplies.
Processing and Storage Interactions
Once ingested, records undergo enrichment with customs status and carrier updates, tasks that require joins across disparate databases. When import volumes rise, storage I/O operations compete for bandwidth, and query planners in relational systems may select suboptimal execution paths under sustained load. Figures from the Australian Bureau of Infrastructure, Transport and Regional Economics indicate that average dwell times at container terminals extended by 18 percent during 2025 peak periods, generating additional status update messages that further taxed downstream pipelines.
Methods for Systematic Bottleneck Identification
Analysts employ distributed tracing tools to tag individual data records as they traverse each pipeline stage, producing timelines that highlight cumulative delays. Queue depth monitoring at transformation nodes provides early indicators of saturation, while throughput counters at output endpoints quantify the gap between input rates and delivery rates. Research published by the University of British Columbia's Supply Chain Management Division examined telemetry from three visibility platforms and determined that 68 percent of observed bottlenecks originated in the first two pipeline stages during high-volume windows. Such mapping exercises rely on timestamp correlation across logs rather than isolated metrics, allowing teams to isolate whether delays stem from network, compute, or storage resources.
Geographic variations appear in the data as well. Platforms serving transpacific routes encounter different peak timing than those focused on intra-European movements, and the resulting message patterns influence which pipeline segments reach capacity first. Canadian Border Services Agency reports from 2024 documented a 22 percent rise in electronic cargo declarations during autumn months, illustrating how regulatory filing deadlines compound commercial volume increases.
Integration Challenges Across Multi-Vendor Environments
Visibility platforms frequently incorporate third-party modules for specific functions such as predictive ETAs or anomaly detection. These modules introduce additional serialization steps that can become bottlenecks when data schemas evolve independently. Observers have recorded cases where schema mismatches caused repeated transformation retries, multiplying the effective load on central processing units. The reality is that high-volume import periods amplify these interactions because error rates and retry queues scale nonlinearly with message volume.
Conclusion
Mapping data pipeline bottlenecks requires coordinated measurement across ingestion, transformation, and distribution layers within integrated cargo visibility platforms. Evidence from port authorities and academic studies demonstrates that high-volume import periods, including the October 2026 window, produce predictable stress points tied to message volume and processing complexity. Organizations that implement systematic tracing and queue monitoring obtain granular visibility into where throughput degrades, enabling targeted resource adjustments without broad architectural overhauls. Continued collection of performance data during successive peak cycles supports refinement of these mappings as import patterns evolve.